Integrating Acceleration
Today, for the first time, I looked closely at the raw data off collected my RipXX accelerometer. It seems like the device actually samples at 100 Hz, which is a significantly higher resolution than shown in the analysis program they provide.
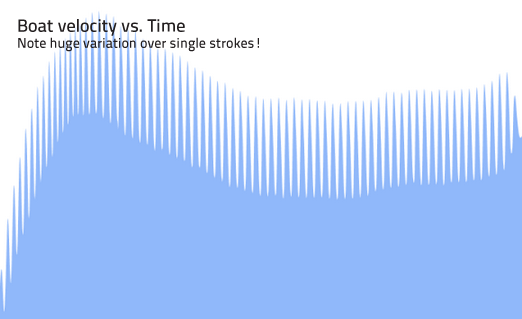
In any case, this sampling rate is high enough that it can provide information that a consumer GPS unit cannot: boat speed fluctuations on the fraction-of-a-second scale. In particular, it can reveal how the boat’s speed changes over the course of a single stroke. The device doesn’t normally record velocity, so I estimated velocity by integrating acceleration with respect to time. Average speeds closely match the data from a Garmin GPS with a second-scale sample rate.
The results are surprising.
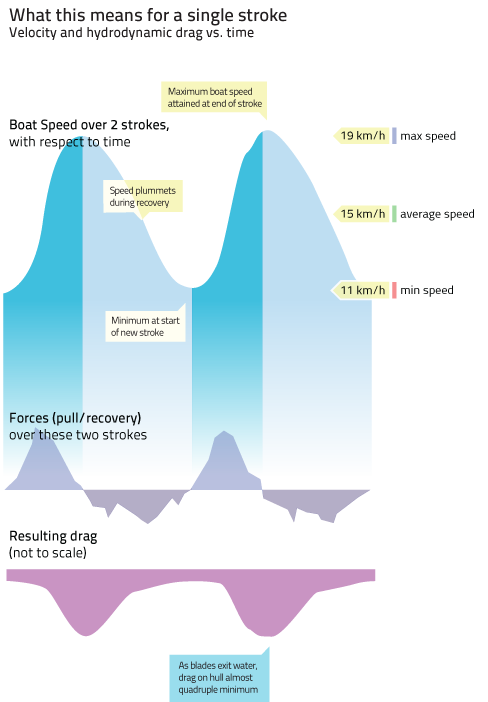
The variation of boat speed over the course of a single stroke is immense! (And therefore the variation in hydrodynamic drag)
The boat was subject to a lot of drag when these data were collected, since the hull hadn’t been cleaned in a while.
However we still see that the change in speed over the course of a single stroke is as great as half of the average speed!
This data has tremendous implications in analyzing how forces vary over the stroke, since the principal component of drag on the boat varies as the square of velocity:
Can anyone confirm these findings?
As far as I know no commercial GPS units are sensitive enough or sample quickly enough to get speed at data at this resolution. Does anyone have a GPS which samples at >20 hz, or an impeller-based device which they could use to confirm these results?
If not, this is data worth confirming by slow-motion video capture, I might do this over the break.


Yohei, the results you are getting seem about right. I have done similar measurements (using the accelerometer on my smartphone which samples 10-20 times/sec) and get a similar pattern – but unfortunately not enough resolution for detailed analysis. GPS simply doesn’t have high enough resolution. An impeller based device would be better but I expect will have some lag and not have enough resolution for the instantaneous data that you want.
Your numbers make sense. Remember that the paddle is out of the water for half the time. So I would expect the speed range to be equivalent to about half of max speed – which is what you got. The deceleration during recovery is exacerbated as when the power is “off”, you throw 4000lbs forward to get ready for the catch. This will slow the boat down significantly. In rowing boats, body movement is in the opposite direction so helps to dampen the extremes of acceleration.
You can also verify the data by using erg results to determine (approximately) total power during the acceleration phase. You know the weight of the boat plus crew and (from the accelerometer) the duration of the acceleration phase.
High speed video taken from side on with a distance reference in the background may give you similar data. For distance reference, piers on a quay would be OK. As the boat moves at 4-5m/s, video at 120 frames/sec will probably suffice. HD video at 30 frames/sec might be OK, certainly worth trying. You don’t need accuracy, just verify that peak and minimum speed are roughly the same as what you get with the accelerometer.
The nice thing about the accelerometer is that you get a picture of performance of the whole team. Joe Gomory’s research shows that there is significant variation between the strokes of an individual paddler, so “whole team measurement” is a good way to go. I think a good way to use this tool is to test different start sequences. You could say have 4 different start routines, Do them in sequence A/B/C/D with a rest and repeat several times. Then again but D/C/B/A in case some variation is caused by the different sequence rather than the start routine itself. Hopefully you will find some significant differences. But I think it may be difficult to detect.
I came across some research on kayak acceleration https://ojs.ub.uni-konstanz.de/cpa/article/download/4821/4461. This shows similar results as what you are getting. Note the difference in peak acceleration between K1 and K4. For a “K20” you would expect the type of results that you got.
Hey Jacob, sorry I haven’t been replying. Crunch time in grad school right now…
Impeller for velocity and accelerometer for acceleration would be the way to go. NK offers a system like this, though it’s aimed at rowing coaches with big budgets and not within in my reach any time soon.
Good to see my rough observations confirmed in a credible source. Thanks for the article!
I’ve found it difficult to look at starts with an acclerometer actually… just looking at the graph of a race it can be quite subtle to tell the difference between “good” and “bad” acceleration patterns. Basically a matter of comparing magnitudes/shapes on the pull vs. on the recovery. During the start you don’t really have a baseline to look at since the average boat speed and therefore the average drag forces keep changing.
More interesting might be something like comparing different stroke styles (ie short high rate, longer lower rate, very rotational vs. hinging etc.) maybe at the same heart rate to make measurements comparable.
Yohei – don’t let me distract you from your school work. But I found some old stuff that may be of interest to you. See http://www.boatdesign.net/forums/boat-design/designing-fast-rowboat-14250-55.html and the entry at 11-09-2010, 10:54 AM by Terry Haines. His comments are very consistent with some-incomplete – theoretical work I have done. No answers, just food for thought – and nice to speculate 🙂
I just had another look at this and noticed something interesting. The boat accelerates 45% of the time and decelerates 55% of the time. As there is little resistance during the recovery phase, it should be possible to speed this up so that the boat accelerates for say 50% of the time. If this can be done, total power delivered over the duration of a race will be increased by 10% (assuming everything else remains unchanged). This will also reduce the range between min and max speed and thus make more efficient use of available power.
This is an interesting (and correct) point, which goes back to one other of my entries (about recovery style versus crew ability basically).
I’d used a strategy like that, with a long flat force curve during the pull and a short recovery back when I was dealing with a more technically experienced crew. Keep the boat accelerating for as long as possible, don’t let it slow down.
I took a lot of these accelerometer readings when I was trying to figure out what was wrong with my newer crew (lots of turnover that year, it’s how college teams go) since they were doing poorly in races relative to how they “should” have been doing.
What I initially saw was massive downward spikes on the recovery. Going back to looking at my crew I realized that this was because they weren’t yet able to control their body motions on the recovery… I had to slow down the recovery for them and speed up the pull so that they could paddle without “throwing the boat backwards” during the recovery.
Ideally, you spend as long on the drive as possible per stroke. In practice with college teams you can’t often choose the “ideal” stroke because people can’t do it.